 Chrome Developer Tools (DevTools) is an amazing set of web-authoring and debug tools for Google Chrome. The DevTools provide access to the elements that build web pages. You can use the DevTools to troubleshoot issues with the layout, look at and modify CSS, set JavaScript breakpoints, inspect the code for optimization, and much more. The DevTools are free and already built into your Chrome browser. So if you have Chrome, then you already have them.
In this article we’ll get an overview of what the tools are and how to use them to improve your WordPress website.
Opening the Tools
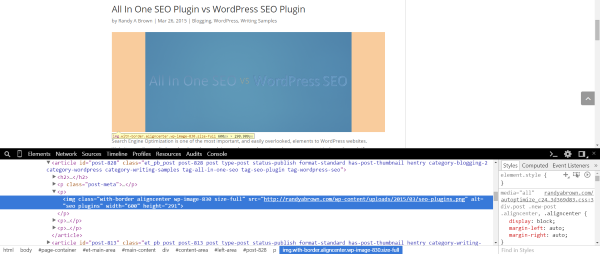
There are several ways to open the tools:
- Select the Chrome menu, choose Tools, and then choose Developer Tools.
- Right click on any element on the screen and select Inspect Element (my preferred method).
- Ctrl + Shift + I (for PC) | Cmd + Opt + I (for Mac)
The DevTools Window
The tools window contains two panels. They both contain tools that can be used together. Here’s a look at the tools.
The first contains 8 groups of tools. The tools include:
- Elements
- Network
- Sources
- Timeline
- Profiles
- Resources
- Audits
- Console
The second section contains:
- Styles
- Computed
- Event Listeners
- DOM (Document Object Model) Breakpoints
- Properties
There are several different ways you can view the tools. You can resize the windows to make room. You can also relocate the windows to the right of the screen to give you a split-screen with the tools on one side and your website on the other.
Elements
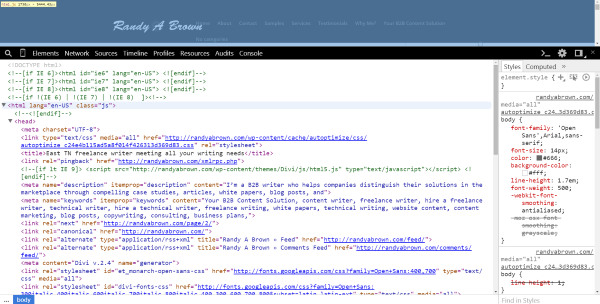
This panel shows you the DOM tree, which represents the HTML elements of your page, and lets you inspect or edit any of the elements. You can see CSS adjustments in real-time.
You can open and collapse any of the panels to make it easier to see and navigate by clicking on the nodes (they look like arrows or triangles). The DOM tree view shows the current state of the tree rather than original HTML (for example, it may have been modified by JavaScript).
When you mouse over an element in the tree view the element on the webpage will highlight. It will show you information such as font style, image size, etc.
If you click on one of the elements, the window in the right will show the CSS. Here you can select styles and make modifications to fonts, colors, sizes, margins, borders, padding, etc.
In the footer you’ll see breadcrumbs so you can backtrack if you need to. You can edit any of the elements just by clicking them and typing your changes. When you hit Enter you’ll see the changes take place.
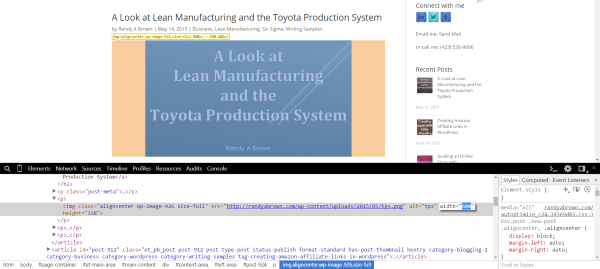
For example, this image is currently 600 pixels wide. I can select the width and type a new value and hit enter.
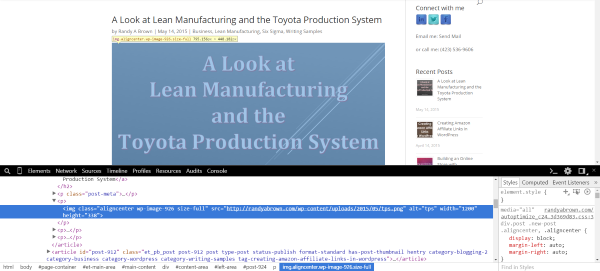
The image immediately changes to the new size.
To change the style of the font, just select the font and select what you want to change in the styles window to the right.

You can even drag the elements around and drop them in new locations to change the layout of your page.
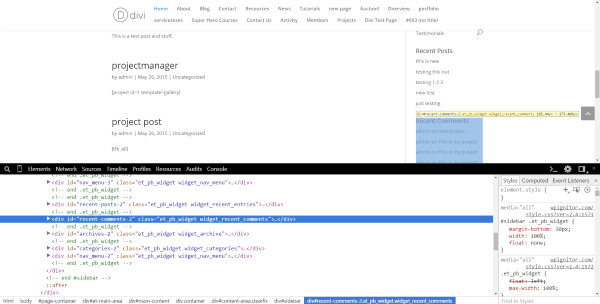
I’m moving recent comments above recent posts just by dragging the div.
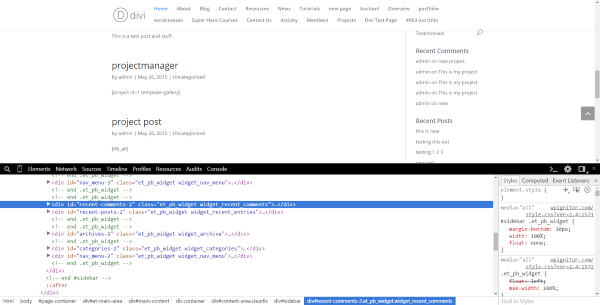
Right clicking gives you a new set of features. You can see various element states, modify as HTML, set breaks, copy the CSS path, and much more. You can also right click and delete a node. It’s so easy it’s almost scary.
I’ve used this tool to find image sizes and to inspect code snippets.
Network

The Network panel shows what resources from your website are requested and download. It is graphed in real time. Seeing which elements take the longest to download gives you insights on what issues to fix in order to optimize your page.
You can filter and show different views and types of charts such as waterfall. You can record network activity and can save it so you can analyze it later.
You can view details of resources. Details include:
- HTTP request and response headers – this displays the request URL, HTTP method, response status codes, and lists the HTTP response and request headers with their values, and query string parameters.
- Resource preview – shows a preview for image and JSON resources.
- HTTP response – this shows the resource’s unformatted content.
- Cookie names and values – this shows the cookies that are transmitted in the resource’s HTTP request and response headers, and clear cookies.
- WebSocket messages – this one shows messages that are sent or received over a WebSocket connection.
- Resource network timing – this shows a graph of the time that is spent on network phases that are involved in loading the resource.
The waterfall view is a great way to see the time it takes for each element to load from the beginning of the request until the last byte of the element is delivered. By seeing which elements take the most time you can have a better understanding of where to make adjustments.
You can save the network data for future analysis.
Sources
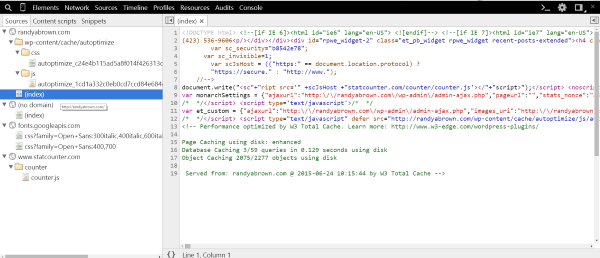
You can use the sources panel to see and debug your code such as JavaScript and scripts that are part of the loaded page. You can pause, resume, step through the code, and pause at exceptions. It includes the basic code execution features so you can step over, step into, step out, and toggle break points. You can use the breakpoints to debug JavaScript, DOM updates, and network calls. You can also set conditional breakpoints where any expression could return as true or false. The breakpoint will then pause the code if the condition is met.
There’s a pretty print feature that makes minified code easy to read. This also makes it easier to see where to place your breakpoints. If this doesn’t work like you need it to you can use a JSON based mapping format called a source map. Source maps are created by a minifier that has this feature built in.
Timeline
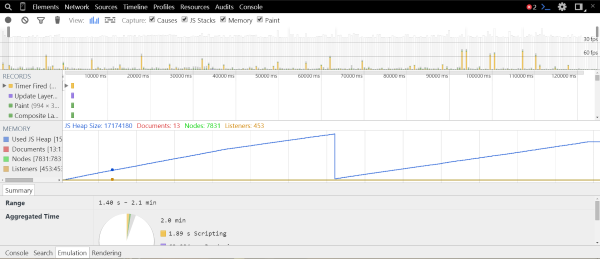
The Timeline panel shows where time is spent for page-loading and usage. It will paint and plot every event on the timeline. It will show resources such as JavaScript, calculating styles, and repainting. You can record the events and analyze them in steps. There are three modes:
- Events – a listing of all the events organized by type. This shows you which tasks take the most time.
- Frames – this shows the work that has to be done in each frame of your website’s rendering performance. For example, if your site renders at 60 frames per second it will show you the work done in 1/60 of a second. This includes loading scripts, painting the layout, handling events, etc. You can use this to view any abnormal activity in page-loading.
- Memory – this graphs out your memory usage over time. It shows you all of the documents, nodes, and event listeners that are held in memory. This helps in figuring out what’s causing memory leaks.
Profiles

Here you can profile the execution time and memory usage of web pages and apps. This shows you where the resources are being used. This is a good tool to optimize your code.
It will record three Profile types:
- Collect JavaScript CPU Profile – this shows the execution time of your JavaScript functions.
- Take Heap Snapshot – this shows the memory usage and distribution of your JavaScript objects.
- Record Heap Allocations – this records your object allocations to show memory leaks over time.
Resources
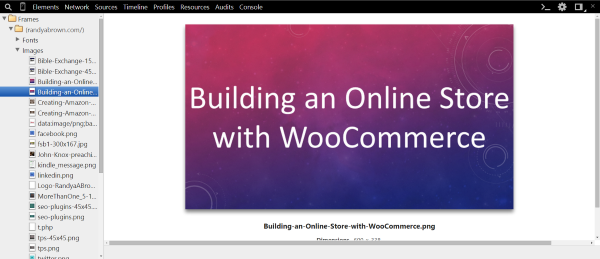
You can use this panel to inspect resources. It will show you information about the IndexedDB, web SQL database, app cache cookies, local and session storage, and more. You can also inspect your visual resources, such as fonts, images, and stylesheets.
The IndexedDB tab lets you inspect your IndexedDB databases and object stores, and view and delete records.
You can run SQL commands and view the results in a tabular format. As you type the commands it will give you hints for table names, commands, and clauses.
The cookies tab shows information about cookies that were created by an HTTP or JavaScript. You can delete them individually or in groups.
Chrome caches application resources. The application cache tab lets you view the status of those resources. It will also show you the resource’s URL, type of resource it is, and its size.
The local and session storage panel lets you to view, create, delete, and edit local and session storage key/value pairs that were creating with the storage API.
Audits
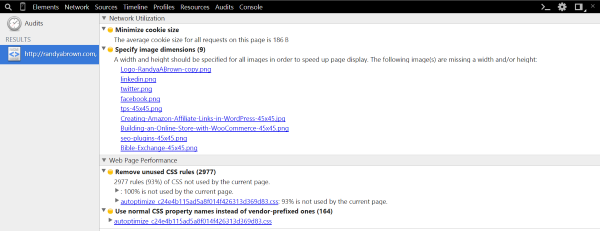
The Audit panel analyzes the page as it loads and suggests fixes to optimize page loading. It has two audits which separates the information into two categories: Network Utilization and Web Page Performance. You can run both audits or just the one you want. You can run the audits in the page’s present state or reload the page and audit on load.
It doesn’t go into as much detail as Google PageSpeed Insights, but it does give you enough information to fix the low-hanging fruit. After going through PageSpeed Insights my page was in decent shape, but it did give me some information about my site that Insights didn’t.
Console

The console is used for debugging. You can log diagnostics, enter commands, evaluate JavaScript, create JavaScript profiles, etc. You can write information to the console through the command line. Using the command line you can use functions to select and inspect elements in the DOM, monitor events, and stop and start the profiler.
Device Mode
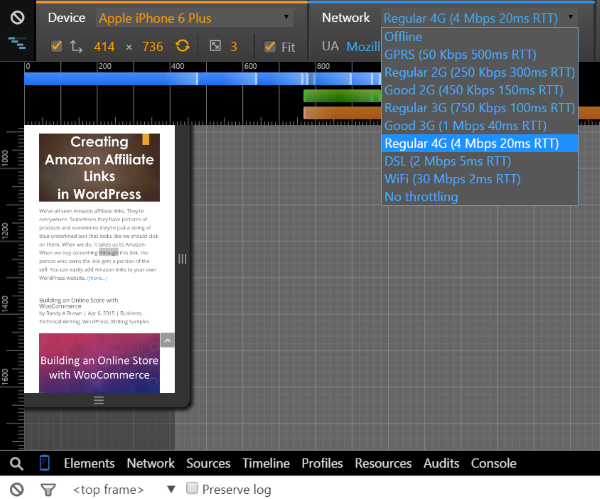
One of my favorite features is Device Mode. You can access this with the little button to the left of Elements in the menu. Device Mode lets you choose from 23 different popular mobile devices (Kindle Fire, several iPhones, several Galaxies, laptops, etc.) and see how your website looks and reacts on that device.
You can also drag the screen to create your own custom screen size. The cursor mimics your fingertip so the screen reacts with the mouse just like it would with your finger. You can also create your own custom devices in the settings screen.
You can also choose the network type (3G, 4G, Wi-Fi, etc.) so you can analyze how the site looks and reacts over the different networks and speeds.
Drawer

At the bottom of the screen you’ll find the drawer. This can be toggled on or off with the >_ button on the right side of the toolbar. The drawer contains:
- Console – the console command line. This makes the console available when using other panels.
- Search – find any source. You can choose to ignore case and search for regular expressions.
- Emulation – tools and settings for device mode. It includes features such as accelerometer and geolocation coordinates.
- Rendering – shows rendering features such as fps meter, composited layered borders, etc. The best part about this one is it will show potential bottlenecks.
It’s useful to have these tools in the drawer because some of the panels don’t include access to these tools.
Final Thoughts
Chrome Developer Tools (DevTools) is an amazing set of web-authoring and debug tools to help you improve your website. You can quickly drag and drop elements to change the layout of your site, troubleshoot memory leaks, troubleshoot page-loading issues, view your website on virtually any mobile device and screen size, and lots more. This overview is just scratching the surface of just how powerful these tools are. The best thing about it is it’s already built into Google Chrome so you don’t have to download anything.
I’d like to hear from you. Do you use Chrome Developer Tools? What are your favorite features? What do you use the most? Do you have any tips on using the tools? Tell us about it in the comments.
chrome is realy great tool.. i use it for debuging my sites and to develop mobile friendly responsive websites